Week 8 2018 – In Review


Most of the major indexes ended the holiday-shortened week with modest gains. The technology-heavy Nasdaq Composite Index performed best, helped by strength in semiconductor stocks early in the week. Positive results from Hewlett-Packard gave a further boost to tech shares on Friday. Utilities and materials stocks also performed well, while real estate shares lagged. Consumer staples shares also under-performed, as WalMart sold off early in the week following an earnings’ miss and guidance that disappointed investors.


European stocks ended the week flat to mixed amid relatively low volume. Despite a heavy week of corporate earnings reports and positive economic indicators, major indexes in the region were subdued. The pan-European index STOXX 600 index was essentially flat as investors seemed to be on guard about the prospect of rising inflationary pressures. The German DAX 30 ended marginally higher following reports of solid demand for German exports. Britain’s FTSE 100 ended marginally lower, weighed down by some disappointing corporate earnings and a report that the unemployment rate rose slightly in the fourth quarter of 2017.


Data suggest that Japan’s manufacturing activity and exports remain positive. Purchasing managers’ index figures released on Tuesday fell slightly to 54.0 in February 2018 from 54.8 in January but remain solidly in expansive territory. Japan’s exports rose 12.2% in January versus the same month last year, exceeding the forecast gain of a 10.3% rise and marking the 14th straight month of gains. Combined with a slight decline in import growth, the rise in exports helped narrow the country’s trade gap to ¥943 billion versus ¥1,092 billion in January 2017. In addition, employment increased at a faster pace and saw its best growth in 11 years.


The Week Ahead


The second-largest economy in the world (China) will reveal their manufacturing and non-manufacturing numbers for February. Economists are expecting the manufacturing figure to rise from 51.3 to 51.4 in January, and the consensus is for a reading of 55.2 for non-manufacturing, down from 55.3 in January. The manufacturing sector has been growing at a slower rate recently, but keep in mind the September reading was the highest since 2012. Conversely the non-manufacturing industry has risen in the past four months and is near a multi-year high.

On Wednesday, Europe released its CPI figures -the lack of inflation in Europe has been one of the more puzzling aspects of the resurgence in economic activity across the region in recent months. Multi-year highs in PMIs have shown that growth is steady and unemployment is falling, yet inflation has remained stubbornly low. Last week’s final CPI rate for January showed prices at 1.3% and core prices at 1%. While GDP suggests the economy is doing well, consumer spending has remained subdued. With the European Central Bank (ECB) on course to exit its asset purchase program this year, a higher euro will continue to cause problems for the ECB in meeting its inflation target.


All the best

Stuart

CEO

Farringdon Group

+60 3 2026 0286


Week 7 2018 – In Review


US Markets – Worst week in two years is followed by Best week since 2013

Stocks carried over the momentum they had recaptured the previous Friday and recorded their best weekly gain since early 2013. The Nasdaq Composite performed best, helped by solid gains in the stocks of Apple and networking equipment maker Cisco Systems. Along with information technology, the financials, health care, and industrials and business services sectors also outperformed within the S&P 500 Index, while energy shares lagged despite a sharp rally in oil prices on Wednesday. The US indexes ended Friday with gains for the year to date and only 4% to 5% off their January highs.

The market’s rebound appeared to be driven in large part by diminishing fears about higher inflation and interest rates. Wednesday morning’s consumer price inflation data came in a bit higher than expected.


European Markets Higher

European stocks ended the week higher, with most major indexes showing strength in a variety of sectors as concerns about rising interest rates and inflation apparently eased. The pan-European STOXX 600 index couldn’t recover the steep losses it logged from the week before, but investor appetite for European shares was nevertheless robust, as the STOXX 600 rose around 3% for the week. Blue chip indexes, including Germany’s DAX 30 and the UK’s FTSE 100, also strengthened. Technology, banking, and natural resources shares were some of the standout performers.


Positive European Corporate News

With corporate earnings reports in full swing, most companies were topping earnings estimates. As of the end of the week, 54% of companies listed on the STOXX 600 had beaten estimates, and earnings to date had grown about 17% compared with the first quarter of 2017. Stripping out energy shares, earnings growth was 10%. Similar to the U.S., the strength in earnings mainly came from cyclicals and financials.


Chinese New Year shortens their working week

Chinese stocks advanced in a holiday-shortened week, paring some of their big declines from the previous week’s global sell-off, as the country prepared for the Lunar New Year holiday. Each year, China’s economy grinds to a halt during the week-long holiday, the country’s most important annual ritual. Chinese mainland markets are closed from February 15 to February 21 this year, though trading was muted in the days before the holiday’s official start.

Departing from its usual practice, the People’s Bank of China (PBOC) reportedly drained $216 billion from the country’s financial system in the weeks preceding the holiday. The PBOC’s recent austerity—following years in which the central bank routinely pumped money into markets to ensure ample liquidity for banks and investors—was seen as part of Beijing’s ongoing crackdown against excessive risk-taking fueled by readily available money.

For over a year, Chinese officials have acknowledged the dangers imposed by the country’s credit-fueled economic growth and pledged to de-risk its financial system. Many analysts regard China’s deleveraging campaign as long overdue and necessary to forestall a severe credit crisis, which they believe poses a key risk for the global economy. “History suggests that China’s debt overhang, if left unaddressed, could post risks to its financial stability and growth,” the International Monetary Fund warned in a recent working paper on China. “With China’s rising economic footprint and its growing influence on global financial markets, its ability to deflate the credit boom safely matters not only for China, but for the global economy.


All the best

Stuart

CEO

Farringdon Group

+60 3 2026 0286


Week 6 2018 – In Review


Stocks Endure Worst Week in Two Years

Stocks suffered their worst weekly decline in two years as investors appeared to worry about rising interest rates and elevated valuations. The major benchmarks fell largely in tandem, and all entered correction territory, declining 10% from their recent highs (the S&P 500 was still up over 13% from a year earlier however).

A sharp rise in average hourly earnings appeared to have set off the market’s slump the previous Friday and worries about rising wage pressures seemed to play a continuing role in the week’s declines. Thursday brought further evidence of a tightening labour market, with weekly jobless claims falling to their lowest level since January 1973, when the U.S. labor market was a little over half its current size. The prospect of increased Treasury borrowing may have also fueled fears of higher bond yields and interest rates.

Legislation sharply increasing both defense and other forms of discretionary spending was signed into law by President Donald Trump on Friday morning. Many expect that the extra spending, combined with recent tax cuts, will force the government to borrow over $1 trillion in the coming fiscal year, the most since the stimulus measures following the global Financial Crisis in 2008–2009.


European Stocks Fall in Line

European stocks also fell during a week of volatility and fears about the global ramifications of a broad stock sell-off in the U.S. Earlier in the week, the European benchmark Stoxx 600 posted its biggest one-day percentage drop since June 2016. Despite a brief respite midweek, European stocks continued to slide as the week continued. The UK FTSE 100 Index, whose companies earn much of their revenue from outside the UK, dropped to a one-year low, hobbled both by the global rout in equities and a weakened pound. Germany’s DAX 30 and France’s CAC 40 were also weak. Banks, utilities, and energy stocks were notable fallers.

The week was not devoid of good economic news; quarterly corporate earnings reported during the week were largely positive. China’s demand for European imports remained strong, and French industrial production rose more than expected in its latest reading. In Germany, Chancellor Angela Merkel finally hammered out a new government coalition between her conservative alliance and the left leaning Social Democrats. Despite this, the DAX still remained in negative territory.


Europe’s Green Shoots are Sprouting

The European Union is on track to continue its fastest expansion since the global economic crisis, according to economic officials for the 19-member eurozone. Gross domestic product could reach 2.3% in 2018, an increase from the 2.1% that EU officials forecast in November. The global increase in trade, relatively low inflation, and beneficial monetary policy from the European Central Bank are accentuating solid growth in the eurozone. But EU officials noted that slow wage growth and higher borrowing costs could act as weights. Uncertainty surrounding Brexit and other geopolitical tensions were also counterpoints that could dim the growth forecast.


UK Inflation Threat?

At its meeting during the week, the Bank of England MPC voted unanimously in favour of keeping the bank rate at 0.5%. However, in its inflation report accompanying the decision, the BoE warned that to bring inflation down toward its 2% target, it may need to accelerate interest rate hikes: “The Committee judges that, were the economy to evolve broadly in line with the February Inflation Report projections, monetary policy would need to be tightened somewhat earlier and by a somewhat greater extent over the forecast period than anticipated at the time of the November Report, in order to return inflation sustainably to the target.” UK inflation hit a five year high of 3.1% in November but has since dropped to 3% in the latest reading. Following the BoE’s somewhat hawkish announcement, UK government bonds sold off, as some investors now expect that rate hikes could come sooner than previously anticipated.


Japanese Stocks Bear the Brunt of Asian Fallers

The Japanese stock indexes resumed their declines, following the U.S. market’s lead. The widely watched Nikkei 225 Stock Average declined 8.1% (1,891 points) for the week and closed on Friday at 21,382.62. Year to date, all the major Japanese market indexes are lower: The Nikkei is down 6.1%, the broader TOPIX Index is off 4.7%, and the TOPIX Small Index has declined 6.4%. The yen strengthened and closed Friday’s trading at ¥108.8 per U.S. dollar, which is about 3.3% stronger than ¥112.7/dollar at the end of 2017.


Sorry its a little late

All the best

Stuart

CEO

Farringdon Group

+60 3 2026 0286

Island Tax Haven Firms Own 23,000 UK Properties


Courtesy of BBC News

I thought I would share this information with you as it is quite significant numbers and HMRC will definitely be looking at this with a fine tooth comb, potentially making new legislation or even imposing more taxation implications, let’s see.


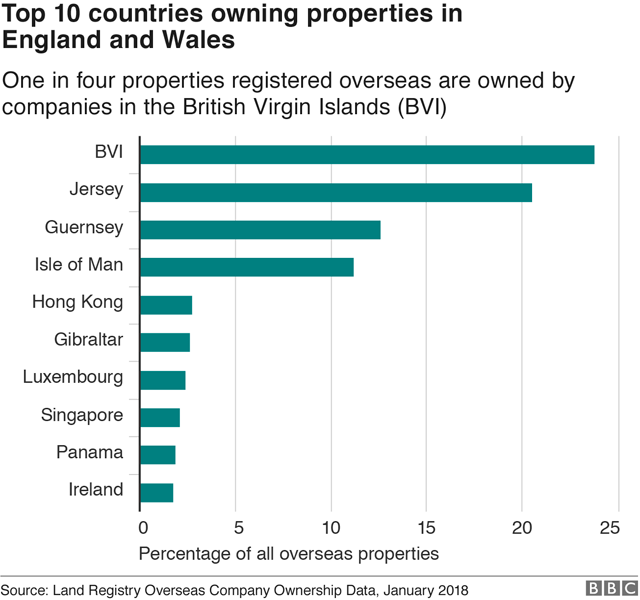
A quarter of property in England and Wales owned by overseas firms is held by entities registered in the British Virgin Islands, BBC analysis has found.

The Caribbean archipelago is the official home of companies that own 23,000 properties – more than any other country.

They are owned by 11,700 firms registered in the overseas territory.

The finding emerged from BBC analysis conducted of Land Registry data on overseas property ownership.

The research found there are around 97,000 properties in England and Wales held by overseas firms, as of January 2018.

It adds to concerns that companies registered in British-controlled tax havens have been used to avoid tax.

Close behind the British Virgin Islands (BVI), which has a population of just 30,600, are Jersey, Guernsey and the Isle of Man.

Of the properties owned by overseas companies in England and Wales, two thirds are registered to firms in the British Virgin Islands, Jersey, Guernsey and the Isle of Man.


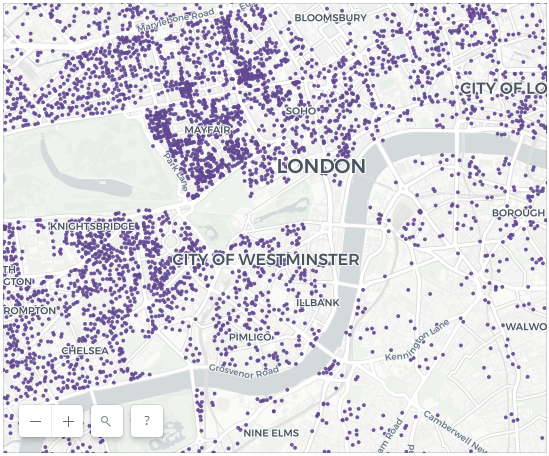
Where are the properties owned by overseas companies located?

Click or tap on the properties owned by companies registered abroad to find out more


Map built by Carto. If you can’t see the map, please click here to open the same story on the BBC News website.

Note: Property locations are approximate based on the centre point of the postcode they fall into. As such they have been removed when the map is zoomed to the most detailed levels. Ownership information like the company name and country refer to the ultimate owner of the property, not necessarily the person or company that may rent or occupy the property.


Many foreign UK property owners are also officially headquartered in Hong Kong, Panama and Ireland.

The analysis provides a new picture of ownership of property by overseas companies in England and Wales following a decision last November to make the database public and free to access.

It found:

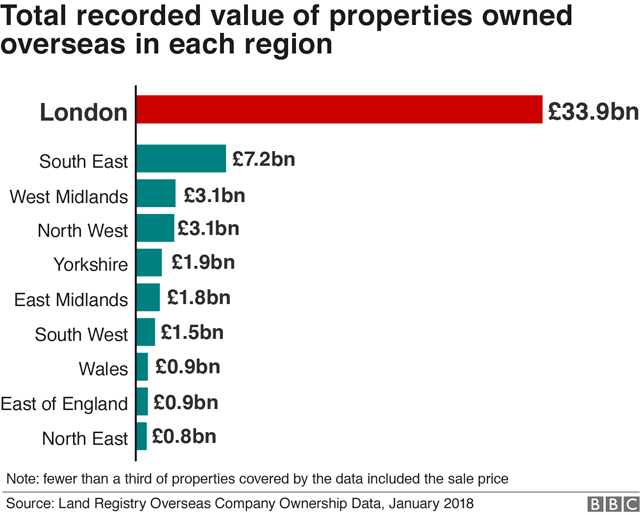
  • Close to half (44%) of all properties owned by overseas companies in England and Wales are located in London
  • More than one in ten (11,500) properties owned by overseas companies in England and Wales are located in the City of Westminster
  • More than 6,000 properties owned by foreign companies are in the London borough of Kensington and Chelsea.


The government of the British Virgin Islands said it was incorrect to label the country as a tax haven.

It said that there were many practical reasons why UK properties might be owned by companies incorporated in the BVI.

It argued that BVI companies can bring together multiple investors and owners, which is useful for big commercial property deals that have investors in more than one country.

The BVI also said that it shared “necessary information” including ownership details with relevant authorities.


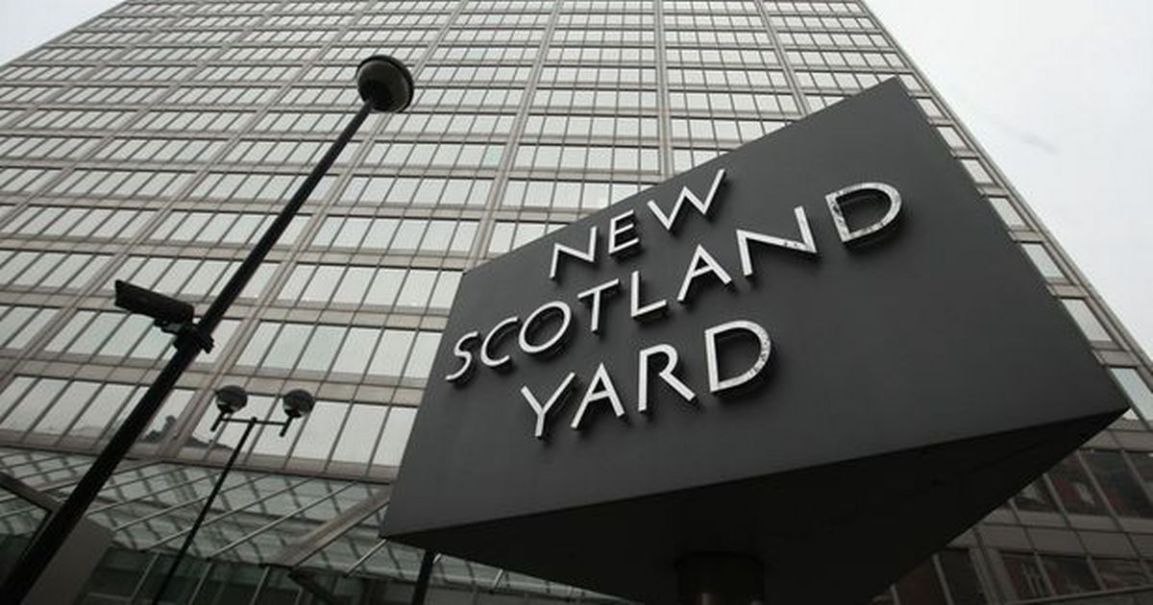
Among those entries in the database that disclosed a price, the most expensive was the former headquarters of the Metropolitan Police, New Scotland Yard, at 8-10 Broadway.

The site was purchased by the Abu Dhabi Financial Group in 2014 for £370m from the Mayor of London’s office. But it is officially owned by a Jersey-based company called BL Development.

The 1967 multi-storey block has now been demolished to make way for “a luxury collection of one to five bedroom apartments across six architecturally striking towers”. These range in price from £1.5m to more than £10m.

The leasehold of Admiralty Arch, the former government building off Trafalgar Squarer that straddles one end of The Mall, was sold to hotel developer Prime Investments for £141m. It is registered to a Guernsey-based entity, Admiralty Arch Hotels Ltd.


While the most expensive buildings are commercial properties such as hotels and office blocks in prime central London locations, many are residential properties rather than business premises.

Take Green Street, London W1 – a residential street of highly-desirable four-storey redbrick Victorian terraces, fronted by smart wrought-iron railings.

Walking east to west you’ll pass one terraced residence owned, according to the latest records, from the Turks and Caicos Islands by a company called Alliance Property Ltd. Next door is another residence owned by Lily Holding & Finance Inc, registered in BVI.

In all, 15 properties on the street are owned by companies registered in the British Virgin Islands, four in Jersey and one in the Isle of Man. Others have owners in Italy, Hong Kong and Singapore.


Accountants used to recommend using an offshore company to overseas buyers of property in the UK as a means of avoiding inheritance tax when the owner passed away.

“Until April 2017, if you weren’t resident in the UK and held a residential property via a company it was not counted as being an asset for UK-based inheritance tax purposes. So having a property through an offshore company meant you escaped inheritance tax,” says Mark Giddens, of accountants and consultants UHY Hacker Young.

However, since last year the government announced plans to close the loophole, dramatically reducing the attractions of offshore ownership of residential property.

Offshore jurisdictions such as BVI still offer buyers who wish to keep their names out of the public realm greater privacy than they would enjoy if they purchased their property as an individual.

While most tax havens have agreed to take part in automatic information exchange, allowing law enforcement agencies to discover the individuals who enjoy beneficial ownership of an offshore company, their names will not appear in the published data.

In contrast to residential properties owned by individuals, the Land Registry does not always release “price paid” figures for properties owned by companies.

Adding up the 27,835 properties whose most recent sale prices we know, the price paid was just over £55 billion.

Notes: The BBC analysed the January 2018 Overseas Companies Ownership data made public by the HM Land Registry. The data is accurate up to January 2018 and contains around 97,000 title records of freehold and leasehold property in England and Wales, registered to companies incorporated outside the UK. The map shows 71,000 of the 97,000 addresses. Those missing had incomplete data.


All the best & have a good day

Stuart

CEO

Farringdon Group

+60 3 2026 0286


Are you an Accidental American ??

‘Accidental Americans’ Putting Asia’s Wealth Transfer at Risk

Courtesy of International Advisor


Accidental Americans face ruin if their estates are not properly structured, a lawyer has warned.


Accidental Americans are often children who are born in the United States but do not grow up there, children who are born outside of America but are automatically US citizens due to having a US citizen parent, or non-US citizens who live abroad but have a green card.

Erik Wallace, a Hong Kong-based US tax lawyer, says he has seen undiminished interest in US citizenship and residency from wealthy individuals in Asia.


A lot of people go to the US to give birth to make their offspring US citizens – Chinese families often do it because they want their children to have the option of a US college education. Another option is to acquire green cards for the family, often through a residency by investment programme; such as the EB-5, US Investor Visa Programme.


While US citizenship creates opportunities in life, it also creates tax complications.

The problem comes in because the US is one of two jurisdictions (the other being Eritrea) to tax its citizens on their global income and capital gains.


FATCA


The US tightened the enforcement of the rules in 2008 when the Internal Revenue Service (IRS) began going after Swiss banks who it believed were assisting Americans hide assets.


The IRS then launched a highly publicised Offshore Voluntary Disclosure Programme in 2009 and imposed additional reporting obligations on non-US financial institutions in 2010 through Fatca (Foreign Account Tax Compliance Act).

Generally, a US person must file a tax return or provide account information even if no US tax is due. Failure to do so comes with hefty civil, and potentially criminal, penalties.


The US grants a foreign earned income credit and a foreign tax credit that often means taxpayers based overseas, particularly those residing in high-tax jurisdictions like the United Kingdom, have no US tax due. However, the taxpayer must still file a tax return to avail themselves of these credits.


Further, the taxpayer must report their non-US bank accounts in most circumstances on a form known as the Foreign Bank and Financial Accounts (FBAR), regardless of whether tax is due. For US taxpayers living in low-tax jurisdictions, like Hong Kong, they often owe tax with their US tax returns.


The Importance of Estate Structuring


The US also imposes US federal estate tax on its citizens (at rates currently up to 40%) on the fair market value of a US person’s global estate when they pass away.

“If an estate is not properly structured, the US estate tax can be disastrous for the family, especially if combined with the local estate or inheritance tax,” explains Wallace.


“If a family wants to leave a business to a US child, it can become subject to this 40% tax, which has been historically 50%. You are looking at the loss of the business before you reach the third generation.


“With proper structuring the US federal estate tax can be avoided or the impact minimised; there is nothing egregious about that and it doesn’t have to be expensive,” advises Wallace.


Some families would prefer to pay to set up a private trust company – it takes time and money but it gives the family more control.


Doing nothing and simply avoiding US tax collectors is not an option. Wallace warns that the IRS is “quite aggressively” going after the “low hanging fruit” with fines and back taxes.


“It has never been a more dangerous time to remain non-compliant due to Fatca as the IRS is collecting information from around the world about financial institution’s US account holders,” he said.


“However, the IRS currently has in place a streamlined programme which allows these ‘accidental Americans’ to get back into compliance by filing three years of tax returns and six years of FBARs and explaining their situations. But this streamline programme remains open at the discretion of the IRS, so act fast.”


If you would like to know more and how we can assist, we also have our SEC license in Singapore so we are regulated and experienced in assisting US Citizens.

All the best & have a good day

Stuart

CEO

Farringdon Group

+60 3 2026 0286


Getting Under the Skin of Pension Transfers – The Importance of Explaining Risk

Good Morning,

I thought I would share a very interesting article from one of our providers Old Mutual and David Denton, Head of International Technical Sales.


It is vitally important to explain risk to clients who are transferring their defined benefit (DB) pensions.

When clients’ benefits are within the DB world, all the risk is managed by the DB scheme itself and the sponsoring employer. When a transfer into a defined contribution (DC) pension is completed, the investment risks and their management become the direct responsibility of the adviser and the client. Financial advisers need to make sure that their clients understand what that means and what outcomes they could face.

A good place to start is with the four concepts – longevity, sequence of returns, volatility and inflation. Once the client understands these concepts, the adviser can move on to an analysis of their personal circumstances. Here is a simple example to explain each concept.

A client who:

  • has £100,000,
    • withdraws £5,000 annually in arrears
    • achieves 4% per annum growth after all charges.
  1. Longevity risk

Taking the example and plotting the outcome, over time, the £100,000 will be eroded by the withdrawals and the fund will run out shortly after the 40th anniversary.


If the client lives until this point, they’ll face financial hardship because they can no longer rely on this fund. This is known as longevity risk.


  1. Sequence of returns risk

As we know, the investment markets don’t go up every year by a fixed amount – they fluctuate over time. To demonstrate how the investment markets work and the concept of ‘sequence of returns risk’, it’s helpful to use a simple sequence of returns over a five year period as shown below:


The average over this five year period is 4% per year. We can generate five sequences of return (1) 4%, 6%, 8%, 10%, -8% (2) 6%, 8%, 10%, -8%, 4% (3)…… and so on. Just choose a starting point for the sequence and then follow the numbers clockwise. To create a sequence that’s longer than 5 years, just keep going clockwise around the circle (repeating the five year cycle).

Then use these sequences within the example and plot the outcome.


This shows that the sequences have different outcomes. Two of the sequences result in more money remaining after 40 years than the average 4% pa return scenario used for longevity risk. Three sequences result in money running out sooner. The worst case scenario is the fund runs out after 33 years. This demonstrates the sequence of returns risk.


  1. Volatility risk

However, what happens if the investment returns go up and down by greater amounts? We can demonstrate the concept of volatility risk, simply by taking the simple sequence of returns and making them more volatile. The average over the 5 year period remains at 4% per year.


As before, you can use these sequences within the example and plot the outcome.


This shows that volatility has a detrimental effect. All the sequences result in money running out sooner than the 4% pa average return. The worst case scenario is the fund runs out after 23 years. This demonstrates volatility risk.

  1. Inflation risk

To demonstrate inflation risk we just need to take the example in 3 above and increase the rate of withdrawal by inflation. We do this to maintain the purchasing power of the withdrawals.

We use an inflation rate of 2% per year and plot the outcome.


This outcome shows all four risks and their combined effect is very different to where we started. The worst case scenario in this example is the fund running out after 19 years and the best case scenario is 27 years.

Demonstrating these concepts and educating DB clients on the risks they face is central to the PFS Adviser Good Practice guide for transfers, particularly around the attitude to risk and sustainability of income.

Once clients understand, they can make more informed decisions and have a greater understanding of their adviser’s recommendations. After all, they will be looking to them to help them manage these risks throughout increasingly long retirement years.

This article was inspired by the Sequencing of Returns paper written by Milvesky in 2006.


All the best & have a good day

Stuart

CEO

Farringdon Group

+60 3 2026 0286