Getting Under the Skin of Pension Transfers – The Importance of Explaining Risk

Good Morning,

I thought I would share a very interesting article from one of our providers Old Mutual and David Denton, Head of International Technical Sales.


It is vitally important to explain risk to clients who are transferring their defined benefit (DB) pensions.

When clients’ benefits are within the DB world, all the risk is managed by the DB scheme itself and the sponsoring employer. When a transfer into a defined contribution (DC) pension is completed, the investment risks and their management become the direct responsibility of the adviser and the client. Financial advisers need to make sure that their clients understand what that means and what outcomes they could face.

A good place to start is with the four concepts – longevity, sequence of returns, volatility and inflation. Once the client understands these concepts, the adviser can move on to an analysis of their personal circumstances. Here is a simple example to explain each concept.

A client who:

  • has £100,000,
    • withdraws £5,000 annually in arrears
    • achieves 4% per annum growth after all charges.
  1. Longevity risk

Taking the example and plotting the outcome, over time, the £100,000 will be eroded by the withdrawals and the fund will run out shortly after the 40th anniversary.


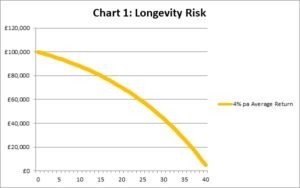
If the client lives until this point, they’ll face financial hardship because they can no longer rely on this fund. This is known as longevity risk.


  1. Sequence of returns risk

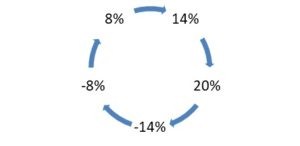
As we know, the investment markets don’t go up every year by a fixed amount – they fluctuate over time. To demonstrate how the investment markets work and the concept of ‘sequence of returns risk’, it’s helpful to use a simple sequence of returns over a five year period as shown below:


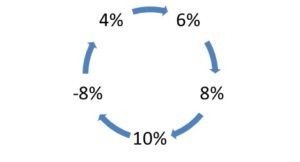
The average over this five year period is 4% per year. We can generate five sequences of return (1) 4%, 6%, 8%, 10%, -8% (2) 6%, 8%, 10%, -8%, 4% (3)…… and so on. Just choose a starting point for the sequence and then follow the numbers clockwise. To create a sequence that’s longer than 5 years, just keep going clockwise around the circle (repeating the five year cycle).

Then use these sequences within the example and plot the outcome.


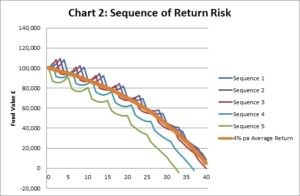
This shows that the sequences have different outcomes. Two of the sequences result in more money remaining after 40 years than the average 4% pa return scenario used for longevity risk. Three sequences result in money running out sooner. The worst case scenario is the fund runs out after 33 years. This demonstrates the sequence of returns risk.


  1. Volatility risk

However, what happens if the investment returns go up and down by greater amounts? We can demonstrate the concept of volatility risk, simply by taking the simple sequence of returns and making them more volatile. The average over the 5 year period remains at 4% per year.


As before, you can use these sequences within the example and plot the outcome.


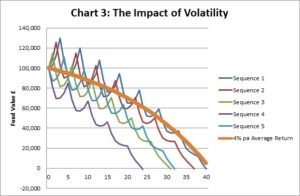
This shows that volatility has a detrimental effect. All the sequences result in money running out sooner than the 4% pa average return. The worst case scenario is the fund runs out after 23 years. This demonstrates volatility risk.

  1. Inflation risk

To demonstrate inflation risk we just need to take the example in 3 above and increase the rate of withdrawal by inflation. We do this to maintain the purchasing power of the withdrawals.

We use an inflation rate of 2% per year and plot the outcome.


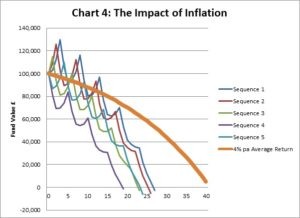
This outcome shows all four risks and their combined effect is very different to where we started. The worst case scenario in this example is the fund running out after 19 years and the best case scenario is 27 years.

Demonstrating these concepts and educating DB clients on the risks they face is central to the PFS Adviser Good Practice guide for transfers, particularly around the attitude to risk and sustainability of income.

Once clients understand, they can make more informed decisions and have a greater understanding of their adviser’s recommendations. After all, they will be looking to them to help them manage these risks throughout increasingly long retirement years.

This article was inspired by the Sequencing of Returns paper written by Milvesky in 2006.


All the best & have a good day

Stuart

CEO

Farringdon Group

+60 3 2026 0286

Week 5 – 2018 In Review


Stocks Record First Weekly loss this Year

Stocks recorded their first weekly loss of 2018, with the S&P 500 Index suffering its worst weekly drop in two years. Energy stocks led the declines due to a plunge on Friday following lower-than-expected earnings results from Chevron and ExxonMobil. Health care shares were also especially weak after tumbling Tuesday on news that Amazon.com, Berkshire Hathaway, and JPMorgan Chase were planning to cooperate in establishing a health care system for their U.S. employees. Financials fared better, helped by rising bond yields, which augur well for improved lending margins.

Some consolidation and profit-taking before the end of January appeared to be behind the declines, as was a climb in Treasury yields. The potential disruption in the health care sector also cast a wide shadow, as investors worried whether drug companies and health care service providers would see their profits slashed if Amazon brings its cost-cutting techniques to the sector.

The steep rise in bond yields—the yield on the 10-year Treasury note jumped to its highest level in about four years—corresponded with a sharp drop in bond prices. (Bond prices and yields move in opposite directions.) Municipal bond prices fell with Treasuries, but analysts noted that muni demand remains strong and easily able to absorb new supply.


Oil Price Under Pressure

High yield bonds experienced some weakness due to outflows from the asset class and lower commodity prices. Crude prices fell as the number of U.S. rigs drilling for oil reached the highest level since last August, suggesting that increased domestic output could impede further gains in oil prices. The stronger U.S. dollar also weighed on commodity prices. Many commodities are priced in U.S. dollars and become relatively more expensive on world markets—reducing demand—as the dollar appreciates.


European Stocks Fall as Growth reaches Decade High

A broad-based retreat pushed European equities lower for the week as key regional indexes, including Germany’s DAX 30, France’s CAC 40, and the pan-European STOXX Europe 600, posted losses. The UK’s blue chip FTSE 100 Index lost almost 3% for the week, its worst performance since November. A rise in bond yields, which tend to make stocks look relatively riskier, was one of the underlying reasons for the equity sell-off. Corporate earnings were generally solid, and many investors seemed to believe that stock markets were repricing given a strong January performance.

The economic recovery in the Europe Union (EU) continued to strengthen, as annual gross domestic product (GDP) rose to 2.5% in 2017—the strongest level in a decade—and EU growth outpaced both U.S. and UK GDP growth in 2017. Statistics agency Eurostat also noted that EU growth in the third quarter of 2017 was revised upward to 0.7% from 0.6%.


Stocks Record Massive Inflows, Bonds Sold Off

The Financial Times, citing weekly flow data by EPFR, reports that equity funds enjoyed their biggest monthly inflows on record in January, attracting about $100 billion. EPFR notes that $25.6 billion flocked into equity funds in the week ended January 31, lifting the month’s total above the prior record haul of $77 billion in January 2013. It added that exchange-traded funds (ETFs) dominated the inflows.

Eurozone government bonds, particularly in core countries, sold off this week, and yields climbed amid expectations of less accommodative monetary policy over the coming year. The yield on 10-year German bunds rose to 0.77% by the end of the week.


Japan’s Manufacturing Activity Hits 4 Year High

January’s final Markit/Nikkei Japan Manufacturing Purchasing Managers’ Index (PMI) reading stood at a seasonally adjusted 54.8, up from December’s final reading of 54.0. The index remained in expansion territory (above 50.0) for the 17th consecutive month. At the same time, rising commodity prices pushed up input costs, which spurred the fastest output price increases since October 2008.

Coupled with the manufacturing gains, Japanese exports rose 9.3% year-over-year to ¥7.3 trillion ($66.3 billion) in December, according to the Ministry of Finance. Exports to China increased 15.8%, and shipments to the entire Asia region expanded 9.9%, paced by sales of semiconductor production equipment and electronic parts. Although slightly below analysts’ forecasts and November’s 16.2% export growth, Wednesday’s release came the day after the Bank of Japan’s (BoJ) positive take on inflation expectations. The BoJ confirmed its conviction in the economic recovery and expressed confidence that inflation is gradually rising toward its 2% goal. Taken together, the data point to another quarter of gross domestic product growth—an eighth consecutive quarter of Japanese economic expansion.


All the best & have a good week

Stuart

CEO

Farringdon Group

+60 3 2026 0286


Market Wrap January 2018


Trouble with Bonds

There is growing trouble in the global bond markets. US 10 year treasury yields have spiked to as much as 2.59%. This is causing many pundits at the Davos World Economic Forum to begin warning of a future market crash and an end to the 34 year rally in bounds.

The IMF is warning that over leverage in emerging markets could cause a financial crisis as the pool of offshore cheap US dollars dries up and borrowing rates start to rise.

While this is certainly a concern it is worth noting that the same people have been making the same predictions for some time. In 2013 we saw the Taper Tantrum which was caused by expectation of tightening from the Fed. In the end the Fed pulled back from tightening to give countries like China more time to get their finances in order.

India has recently recapitalised its banking system to cover bad debts and China has stated at Davos that no Chinese Bank will be allowed to fail under any circumstances.

The Republican tax cuts in the US are likely to exacerbate the situation for two reasons, firstly companies like Apple with large offshore holdings of US dollars will now be returning these to the USA. Secondly, cutting taxes just at the point the US reaches full employment will boost inflation. As the Fed steps in to raise rates at the same time it is cutting QE then we will see a significant increase in the cost of offshore US borrowing costs.

However this scenario now has been around for at least the last 5 years and governments and companies are now much better prepared than they were.

For the time being it is better to stay in shorter dated inflation linked bonds staying underweight in bonds overall. Equity growth should remain strong until at least the end of the year and it is better to use Gold to hedge out against uncertainty than bonds in the current climate.


The End of Bitcoin?

Bit coin prices have dropped by almost half since the end of December. Prices appear to have stabilised in the $10,000 – $11,000 range after spiking as high as $19,000 at the end of December. However the current Bit Coin Chart as you will see below looks to show the classic signs of the bust that follows any mania.


If Bit Coin prices continue to fall in the classic mania phase then prices could reach between $600 and $1000 in the next 12 to 18 months.

However those that believe in the future of crypto currency believe strongly at they are likely to be able to support process in the $3000-$5000 range.  We may have seen the ‘dead cat bounce phase’ of the standard bubble in late December early January or the Current stabilisation may be the start of the phase with prices moving up to $14,000 – $16,000 as people buy on the dip.

So, that would only seem likely if there was some positive news flow to come out which seems unlikely. Governments from South Korean and China to France and Germany have all begun moves to either ban or heavily regulate Cryptocurrency. Once the US and the UK follow suit then prices will begin to fall again.

It would seem wise to take profit from Crypto currency just now and wait and see if any currency emerges dominant after the fall over the next 12 months before moving back in.


The Pound Moving Forward

Frances President Macron’s visit to the UK has seen the pound move up as high at $1.40, a post Brexit high. Warm words from the French leader and a feeling that a softer Brexit may be at hand have caused the bound to rise. Strong employment figures in the UK as well as high inflation also make it seem likely that the BOE will continue to raise rates.

Moving forward the Euro may have some issues around the Italian elections which may further boost the appeal of the pound. It seems likely that the pound will continue to rise in the $1.50 range over the next year however if no deals are done before the end of 2018 it could experience significant volatility.


All the best & have a good day

Stuart

CEO

Farringdon Group

+60 3 2026 0286


Week 4 2018 In Review


Major Indexes Continue Rally

Stocks continued their winning streak in the new year, with the major indexes notching their fourth consecutive weekly gain and moving to new record highs. The large-cap indexes performed much better than the mid- and small-cap benchmarks, however. Within the S&P 500 Index, healthcare and consumer discretionary stocks led the gains, while energy, utilities, and consumer staples stocks lagged.


US Dollar Hits a 3 Year Low

Despite the flood of corporate earnings reports, the week’s most notable movements may have taken place in the Treasury and currency markets. On Monday, positive economic news and the end to the government shutdown helped push the yield on the 10-year Treasury note to over 2.66%, its highest level in nearly four years. (Bond prices and yields move in opposite directions.) In its initial report on fourth quarter gross domestic product, the Commerce Department said that the US economy had grown at a 2.6% annualized pace in the last three months of 2017. The number was less than expected, but GDP growth remains strong enough to drive the unemployment rate lower and, for all of 2017, exceeded the Federal Reserve’s projections.


Yields fell back a bit on Tuesday but then hit a new multiyear high on Wednesday after the US dollar hit a three-year low—a falling dollar makes holding Treasuries and other US assets less attractive to foreign investors. The dollar’s drop followed comments from US Treasury Secretary Steven Mnuchin, who said that a weaker dollar was good for the US in terms of export opportunities. Mnuchin later qualified his comments, and the dollar rose and bond yields fell back on Thursday after President Trump voiced support for a strong dollar at the World Economic Forum in Davos, Switzerland.


UK Reports Stronger than Expected Growth

The British pound strengthened along with the euro, reaching its highest level against the dollar, $1.42, since the Brexit vote in June 2016. The British economy beat consensus expectations and grew at an annualized rate of 2.0% in the fourth quarter. UK growth for 2017 came in at a five-year low of 1.8% but still outpaced most forecasts that were made following the UK’s decision to leave the European Union. UK 10-year government bond yields rose for the week.


ECB Makes no Change to Policy

At its January monetary policy meeting, the European Central Bank (ECB) kept its interest rate and bond-buying program unchanged, as expected. The ECB had reduced its monthly asset purchases from €60 billion to €30 billion starting in January and said it still plans to maintain that pace at least through September. The 10-year German government bond sold off during the week, sending its yield above 0.60% for the first time in six months.


European markets flat, while EUR Strengthens

The pan-European STOXX 600 index was little changed during a week in which investors seemed more focused on currency news than stock-specific reports. After the US Treasury secretary’s weak-dollar comments, the euro rose to a three-year high versus the greenback and finished the week at about $1.24, while the British pound strengthened to $1.42. The UK’s FTSE 100 and Germany’s DAX 30 both lost ground for the week.


China’s Industrial Profits Dip in December Despite Good Year

Industrial profits in China rose at the slowest pace in a year in December, capping a year of strong growth that is expected to yield to a slowdown in 2018 as Beijing presses on with its campaign to reduce credit risks in the economy.

Industrial profits increased 10.8% in December from the prior-year period in local currency terms, down from November’s 14.9% gain. For the full year, industrial profits jumped 21%, the fastest pace since 2011, driven by cuts in excess capacity, the statistics bureau reported.

Economists chalked up last month’s industrial profits slowdown to a nationwide pollution crackdown targeting smokestack industries, as well as to slower growth in inflation as measured by China’s producer price index (PPI). The PPI—which measures the cost of goods as they leave the factory gate and serves as a leading indicator for consumer prices—rose at its slowest pace in 13 months in December. Last year’s rising PPI readings underscored China’s buoyant economy, allowing the country’s industrial companies to report strong profits growth in 2017.

Growth in China’s PPI and industrial profits is expected to moderate in the coming months, as officials have pledged to rein in credit growth and take other steps to reduce risks stemming from too much debt.


The Week Ahead

US Earnings season will continue to be in full swing next week, along with a handful of important economic reports. Consumer-spending data will be released on Monday, the Federal Reserve’s interest rate decision will be announced on Wednesday, and Thursday brings the ISM Manufacturing Index and US auto sales. On Friday, the US January employment report and durable goods orders will both be released.


All the best & have a good week

Stuart

CEO

Farringdon Group

+60 3 2026 0286

The Pension Debate Continues: DB Pensions AKA Final Salary Schemes –Things you NEED to know and my Opinion


Ok, so I get asked ALL the time ‘what should I do with my UK Final Salary Pension and what guarantees & benefits do I get’, WELL below I have highlighted just a few of the main points you should consider when looking at this and reasons why you should or shouldn’t look at a potential transfer in to a UK regulated SIPP.


There are so many articles being published and it makes me frustrated that they try to make people confused about retirement….Yes you do need to retire with a pension pot, Yes, you should always try to save and Yes, Final Salary schemes or DB’s may not be around when you retire…But to scare people with articles, trying to confuse them because the UK government and FTSE companies will be affected isn’t fair, especially when its these FTSE companies who have underfunded their pensions for their loyal employees.


You as an employee or ex-employee should be able to decide what the best option for you in retirement is and be able to control this, after all you’ve worked your life to retire happily without having to worry about what and or who is going to affect you and it should be easy to do….It sometimes isn’t and this puts people off asking for help.


I/we can help and I will try my best to educate and inform rather than scare and confuse, take control of you pension, be fully informed, understand how retirement is calculated, how annuity rates are compiled, I am happy to share this information with everyone. A pension transfer is not for everyone, BUT in my opinion it’s definitely something to look at very closely with all these companies previously mentioned trying to change rules and under-fund their schemes..


Questions Answers
Is my Final Salary a Guarantee? NO, DB or Final Salary pension is NOT a guarantee, it is a promise and promises can be broken! The government are changing rules and regulations constantly as most schemes are dangerously under-funded, like Carillion, BT, BA, Shell, Tata, BHS etc.
How does my UK pension perform compared to other options? Government may be looking to change the benefit increase from RPI (3-5%) to CPI (2-3% or even get rid of any increase each year)
Expected Performance? UK Pensions are proving to seriously underperform currently at 0-1% growth, we would be looking at 4-5% and the saving on the costs above
Can I still take 25% lump Sum at 55? Yes, you are still able to take 25% PCLS after 55.
What are the succession Benefits? Most DB schemes pass on 50% of the pot to your spouse and then 25% to the children if they are in fulltime education and below 23 years of age. The entire pension may be lost if these boxes are not ticked.

If you move to a SIPP, the wife will receive the pension minus death taxes and if you were above 75, there is no death tax.

What happens if the company I worked for goes in to Liquidation or files for bankruptcy? Once a company begins to struggle to fund a pension, they are within their right to reduce your benefits and effectively take from that pension pot. In the event of total collapse, you may end up on the Pension Protection Fund, whereby your pension benefit may reduce significantly. We believe that if a larger company goes under, the PPF may well fail and pensioners may be left with no pension at all.
Will the UK government stop pension transfers? We don’t think they will stop transfers out, but they may well tax pensions differently or put other restrictions to help protect the UK pension industry.
Will interest rates in the UK affect my pension? Yes, our analysis suggests that this will have the effect of cutting current transfer values by almost half (48%). If Interest rates rise back up to a level of 4% where they were in 2007 then transfer values could be cut by as much as 64% from their current levels.
Is it still a good idea to look at transferring? Yes, Final Salary Pension Transfer Values are based on annuity rates which are in turn based on government bond rates. As the interest on government bonds drops it costs more to provide an annuity and hence the transfer value offered to you must rise. Pension valuations are still at an all-time high and getting a valuation is imperative to making the correct decision before transferring.
Is it easy to get a valuation? Yes, we are able to assist and valuation can take up to 3 working weeks, then we can make the correct calculations as to whether your pension is better served controlled by you.
Does it cost me anything to get a valuation? NO, generally you are allowed 1 or 2 valuations per annum and will be fully calculated by actuaries so your figure may change between valuations
Am I locked in? Pensions, can be accessed via flexi drawdown, but you will be taxed at UK income tax rates. There are a number of options available for drawdown, so it’s always worth exploring these scenarios with an adviser. All SIPPS provide an early retirement date (if chosen) at 55
I have over 5 years until I retire, what’s the best option? Please get a valuation on your current benefit, this will give you the best info of what the expected pension at retirement will be. Be fully informed
Does getting a valuation mean I have to transfer? Absolutely NOT, it is your right to be fully informed about your pension and you MUST know what is best for you and your family
How long does my Valuation last? Once you get a valuation, the benefit is locked for 3 months, to decide if the best action is to transfer is best to do within 4 weeks and transfer to a SIPP can take 6 months
Can I retire early? It depends, because all UK Pensions are regulated by the FCA to ensure that they will provide enough financial support to the individual and their family past their working years and protect them from falling short, the earliest retirement achievable for draw-down of a SIPP is 55. In most cases, Final salary scheme retirement dates are set at 65 resulting in smaller sums paid out by companies and delayed overall retirement dates of individuals.


The main thing that every pensioner should ensure, is that the fund selection within their SIPP is clean and suitable for its purpose. We only use highly regulated daily liquid funds, hence you can be safe in the knowledge that our fund selection is within your risk attitude and from leading fund managers, such as Templeton, Schroders etc.

I hope you find this information useful and informative and you can always contact me directly via email syeomans@farringdongroup.com or call our office +60 3 2026 0286, I am here to help and explain how all this information works, just let me know

All the best

SY


International Adviser – Latest DB Article

This shows companies are trying to change the way pensions are valued

DB pension deficit headache worsens for struggling employers

The UK High Court has ruled that communications group BT cannot change a pension scheme from the retail price index (RPI) to the generally lower consumer price index, placing more significance on an imminent government white paper on defined benefit pension schemes, a legal expert says.

BT is the latest in a line of companies that are struggling to deal with increased pension scheme deficits and have sought to implement a change in the inflation rate they use.

Each scheme has its own contractual rules and some are “broad enough to allow the calculation to be changed, and sometimes not”, pensions law expert Stephen Scholefield of Pinsent Masons said.

“Where there is no flexibility, some had hoped that the courts would decide that RPI was simply inappropriate, regardless of what the rules said,” he said.

The news follows the collapse of Carillion where it is understood its pension scheme has a deficit of about £580m.


Week 3 2018 – In Review


Week Ending 19th January

The major equity market indexes finished with modest gains for the holiday-shortened week. Stocks registered sharp gains on Tuesday, which saw the S&P 500 Index record its best one-day advance since November. Consumer staples stocks led gains within the S&P 500, while energy, industrials and business services, and real estate shares lagged.


S&P 500 Climbs Again

The S&P 500 rose 25 points last week (5% for the year so far) amid the second week of fourth-quarter earnings reports which drove much of the market’s movements. Goldman Sachs fell on Wednesday after reporting mixed results, while rival Morgan Stanley rose on Thursday after beating estimates. IBM fell sharply in early trading Friday, after providing guidance that disappointed many analysts. A one-time charge related to the recent tax reform bill led to a sharp decline in earnings for Citigroup, reported Wednesday. This and other earnings declines in the financials sector led data and analytics firm FactSet to drastically reduce its estimate of overall earnings growth for the S&P 500 Index, to a decline of 0.2% versus an advance of 10% estimated the week before.


Treasury Yields Rise as US Government Shutdown Looms

The policy environment also returned to the forefront and appeared to limit the market’s gains. With federal spending authorizations set to expire on Friday evening, congressional officials scrambled to pass a bill to keep the government funded. The prospects for passage of a compromise measure that would attract enough Democratic votes in the Senate fluctuated but seemed to grow dimmer as the week progressed. The House passed a bill along party lines on Thursday, but the trading week ended without any action in the Senate.

The prospect of a government shutdown beginning Saturday morning diminished the appeal of U.S. assets, pushing the U.S. dollar lower and Treasury yields higher. (Bonds prices and yields move in opposite directions.) Municipal bonds outperformed Treasuries, helped by restrained supply due to light issuance during the shortened holiday week.


European Indices Rise Together

European equities ended the week higher, boosted by rising technology and industrial stocks, a lift in corporate sentiment, and upbeat economic growth data from China. The European STOXX 600 index was marginally higher, recording a 0.5% gain. Germany’s blue chip DAX 30 advanced just over 1%. The French CAC 40 and Spain’s IBEX 35 also gained for the week. The UK’s FTSE 100 managed to stay in positive territory despite some downbeat economic news.

A strong euro tempered some of the equity gains. Eurozone central bankers were raising alarms about the euro’s strength, calling it “a source of uncertainty” and unhelpful. Despite a trend of broadening eurozone economic recovery, December’s consumer price index (CPI) showed that inflation was slowing somewhat. Eurozone CPI came in at 1.4%, with core CPI stubbornly staying at 0.9%. UK inflation dropped back to 3%, and the core inflation was a slightly softer-than-expected 2.5%.


2017 Saw China’s annual Growth Increase for the First Time in 7 Years

China’s economy expanded more than expected in the final quarter of 2017, helping the country deliver faster annual growth for the first time in seven years, though the government’s pledge to prioritize higher-quality growth is expected to lead to a long-term slowdown.

China’s gross domestic product (GDP) increased 6.8% in the fourth quarter of 2017 from a year earlier, the country’s National Bureau of Statistics reported, the same pace as the previous quarter. For the year, China’s GDP rose to 6.9%, up from 6.7% in 2016 and marking the first annual growth uptick since 2010. The full-year growth pace easily beat Beijing’s annual target of around 6.5%. Much of last year’s growth pickup stemmed from growth in exports, as a broadening global recovery drove demand for Chinese goods. However, infrastructure spending and continued credit growth also played a role as government officials sought to maintain economic stability ahead of a leadership transition last fall.

Though China’s economic performance consistently beat forecasts in 2017, analysts believe growth is already slowing, as Beijing has started cracking down on excessive lending and other financial risks. An antipollution campaign that started last fall targeting industries across the country is also expected to curb growth in 2018.


All the best & have a good week

Stuart

CEO

Farringdon Group

+60 3 2026 0286