

This Quarterly Report covers all FTSE100 companies. It includes analysis of all annual reports for years ending on or before the 30 June 2016 and published by 31 October 2016.
This report albeit 6 months old is something to look at as this problem is only getting worse, hence I wanted to share it with you all.
EXECUTIVE SUMMARY
- The total deficit in FTSE 100 pension schemes at 30 June 2016 is estimated to be £117 billion. This is a deterioration of £42 billion from the position 12 months ago.
- Only 54 FTSE 100 companies are still providing more than a handful of current employees with DB benefits (i.e. ignoring companies who are incurring ongoing DB service costs of less than 1% of total payroll). Of these, only 23 companies (i.e. less than a quarter of the FTSE 100) are still providing DB benefits to a significant number of employees (defined as incurring ongoing DB service cost of more than 5% of total payroll).
- There continues to be significant funding of pension deficits. Last year saw total deficit funding of £6.3 billion, up from £6.1 billion the previous year. BT led the way with a deficit contribution of £0.8 billion (net of ongoing costs), but 49 other FTSE 100 companies also reported significant deficit funding contributions in their most recent annual report and accounts.
- The decline in ongoing DB pensions continues. We estimate that after allowing for the impact of changes in assumptions and market conditions, the underlying reduction in ongoing DB pension provision is approximately 10% in the last 12 months.
- There are a number of companies reporting very significant individual changes to investment strategies. Three FTSE 100 companies changed their bond allocations by more than 10%.
- The average pension scheme asset allocation to bonds has increased from 59% to 61%. Ten years ago, the average bond allocation was only 34%.
- There are a significant number of FTSE 100 companies where the pension scheme represents a material risk to the business. Eight FTSE 100 companies have total disclosed pension liabilities greater than their equity market value. For International Airlines Group, the total disclosed pension liability is more than triple its equity market value. For BAE Systems, Royal Bank of Scotland and Sainsbury, the total disclosed pension liabilities are almost double their equity market value.
- Only 28 companies disclosed a pension surplus in their most recent annual report and accounts; 60 companies disclosed pension deficits.
- In the last 12 months, the total disclosed pension liabilities of the FTSE 100 companies have fallen from £614 billion to £586 billion. Ten years ago, the total disclosed pension liabilities were £407 billion. A total of 16 companies have disclosed pension liabilities of more than £10 billion, the largest of which is Royal Dutch Shell with disclosed pension liabilities of £57 billion. A total of 21 companies have disclosed pension liabilities of less than £100 million, of which 12 companies have no defined benefit pension liabilities.
- If pension liabilities were measured on a “risk-free” basis rather than using a AA bond discount rate, the total disclosed pension liabilities of the FTSE 100 would increase from £586 billion to £705 billion, and the total deficit at 30 June 2016 would be around £185 billion.
FUNDING POSITION
The overall funding position of pension schemes of FTSE 100 companies has worsened over the year covered by their latest annual report and accounts.
Including all pension arrangements, both UK and overseas, whether funded or unfunded, the FTSE 100 companies with the best-funded pension schemes overall were as follows:

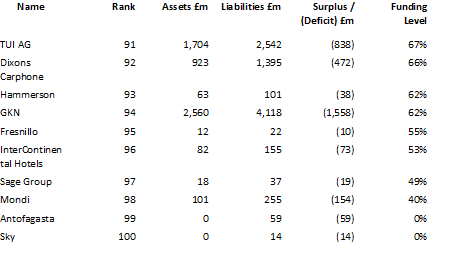
The FTSE 100 companies with the worst funded pension schemes overall were as follows:
In 2007, IFRIC14* provided new guidance on the recognition of surpluses and the impact of minimum funding requirements. Within the FTSE 100, 18 companies have reported that the restrictions imposed by IFRIC14 have had an impact on their pension disclosures.
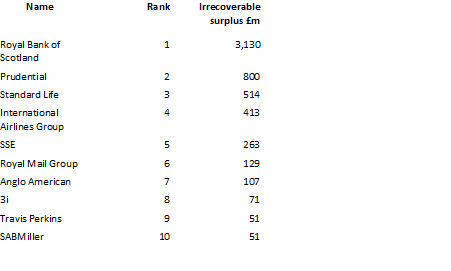
The total reported impact for FTSE 100 companies is now £5.6 billion. The largest reported adjustments for IFRIC14 in the FTSE 100 were as follows:
Adjusting these figures up to the quarter-end, we estimate that the total pension deficit in the FTSE 100 as at 30 June 2016 was £117 billion. This is a deterioration of £42 billion from the position 12 months ago.
* For more information on IFRIC14, see JLT publication – IAS19: A Quarterly Guide for Finance Directors
INVESTMENT MISMATCHING
Legislation over a number of years has clarified that pension liabilities are a form of corporate debt. Despite the fact that there is an increasing weight of opinion from academics and analysts that mismatched investment strategies in pension schemes reduce shareholder value, many companies are still running very large mismatched equity positions in their pension schemes. This has the impact of creating balance sheet volatility, which some academic evidence might suggest flows through to share price volatility.
Inevitably, analysis of mismatching is limited to the information disclosed in the annual report and accounts. Given the bond-like nature of pension liabilities, the allocation of pension assets to bonds gives an indication of the level of investment mismatching that exists. This report refers to investment mismatching in terms of the IAS19 accounting position, where liabilities are being valued using AA corporate bonds; therefore assets other than these bonds will lead to a mismatch.
The FTSE 100 companies with the highest allocation to bonds were:

The FTSE 100 companies with the lowest allocation to bonds were:

The FTSE 100 companies with the greatest change in bond allocation were:
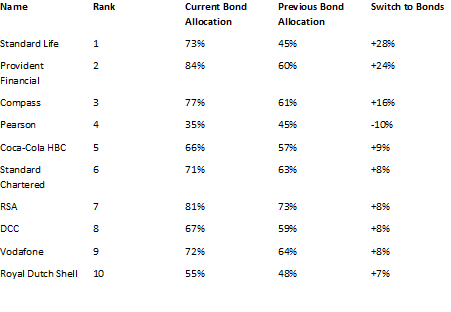
Several companies and trustees are continuing to switch pension assets out of equities into bonds. Standard Life is the latest company to report a big switch, with bond allocations increasing by 28%. A total of 61 FTSE 100 companies have more than 50% of pension scheme assets in bonds. Moreover, company disclosures reveal little of the extensive activity there has been by many companies to use LDI (liability-driven investment) strategies, which frequently make use of derivatives and other financial instruments to improve liability matching.
Overall, though, the average pension scheme asset allocation to bonds is now 61%, which has increased from 59% a year before. This compares to 34% ten years ago.
SIZE OF PENSION SCHEME
In recent years, pension schemes have grown significantly. Attempts by many companies to stem the growth of their pension liabilities by closing defined benefit pension schemes to new entrants have had little impact. Changes in economic conditions and increasing life expectancy have contributed to the spiralling growth in pension liabilities.
The FTSE 100 companies with the largest pension scheme liabilities (all those over £10 billion) are as follows:
The FTSE 100 companies with the smallest pension liabilities (all those under £100 million) are as follows:
In addition, Admiral, ARM Holdings, Burberry, Easyjet, Hargreaves Lansdown, Hikma Pharmaceuticals, Intu Properties, Paddy Power Betfair, Randgold Resources, Shire, St. James’s Place and Worldpay Group all reported no defined benefit pension liabilities.
In the last 12 months, the total disclosed pension liabilities of the FTSE 100 companies have fallen from £614 billion to £586 billion. A total of 16 companies have disclosed pension liabilities of more than £10 billion, whilst 21 companies have disclosed pension liabilities of less than £100 million.
The possibility of measuring pension liabilities on a “risk-free” basis (i.e. using gilt-based discount rates rather than AA bond discount rates) has been debated at length, including in a detailed discussion paper from the Accounting Standards Board. In the UK, a company can no longer default on its promises to pension scheme members unless it goes into liquidation. If pension liabilities were to be measured on a “risk-free” basis, with no allowance for default or further reduction in benefits, we estimate that it would add approximately 20% to the total pension liabilities, increasing the total disclosed pension liabilities from £586 billion to £705 billion. The total deficit at 30 June 2016 on a “risk-free” basis would be around £185 billion.
SIGNIFICANCE OF THE PENSION SCHEME IN THE BOARDROOM
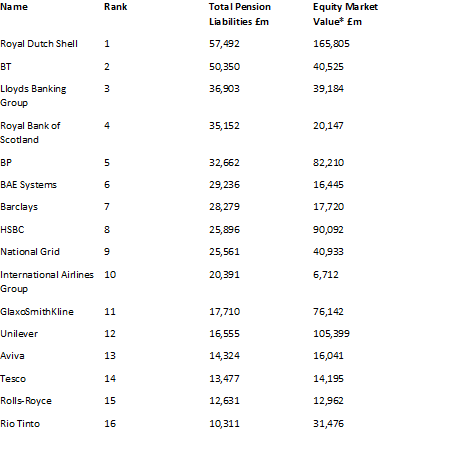
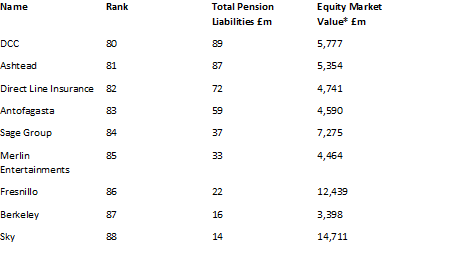
The impact of the pension liabilities on corporate decision-making and its importance in the boardroom depends on the relative size of the pension scheme. In the analysis below, the pension scheme deficit and liabilities are expressed as a percentage of the equity market value of the company. The FTSE 100 companies with the most significant pension scheme liabilities are as follows:

* as at 30 June 2016
** These companies’ pension schemes have purchased contracts, which insure part of their liabilities; the figures in italics represent the impact of the liabilities without these insured sections.
A further sign of the significance of pensions in the boardroom is the extent of continuing DB provision to employees. This can be measured by looking at the ongoing spend on DB pensions (the service cost) before any allowance for deficit spending. The FTSE 100 companies with the highest ongoing spending is shown in the table below, together with the previous year’s spend for comparison.

28 FTSE 100 companies showed zero (or negative) cost of current DB service costs, compared with 27 in the previous year.
Eight FTSE 100 companies have total disclosed pension liabilities greater than their equity market value. For International Airlines Group, the total disclosed pension liability is more than triple its equity market value. For BAE Systems, Royal Bank of Scotland and Sainsbury, the total disclosed pension liabilities are almost double their equity market value. BAE Systems and GKN have a disclosed pension deficit of about one-third of their equity market value. A further six companies have disclosed pension deficits bigger than 10% of their equity market value.
Increasingly companies are reacting to the combination of difficult economic conditions, rising pension costs and increasingly aggressive pension regulations by closing pension schemes to future and even current employees. This decline in total DB pension provision is now apparent in the accounts of FTSE 100 companies, with several companies closing their scheme to future accrual or freezing pensionable salaries. The total current DB service cost is £8.1 billion compared to £7.5 billion in the previous year. However, we estimate that after allowing for the impact of changes in assumptions and market conditions, the underlying reduction in ongoing DB pension provision is approximately 10% in the last 12 months alone. We believe that the next year’s accounts will show that the majority of FTSE 100 companies have ceased DB pension provision to all employees.
IMPACT OF THE PENSION SCHEME ON THE COMPANY’S SHARE PRICE
As already mentioned, there is some evidence that balance sheet volatility caused by pension schemes flows through to share price volatility. Changes in the balance sheet position resulting from pensions can be separated into expected changes and unexpected changes. Expected balance sheet changes arise largely from the contributions paid by the company and the costs shown in the company’s income statement. Unexpected balance sheet changes arise largely from actuarial gains and losses (due to stock market volatility) and changes to actuarial assumptions.
In the analysis below, the unexpected change in balance sheet position (net of change in adjustment for IFRC 14) is expressed as a percentage of the equity market value of the company. We are not suggesting that the balance sheet impact will translate into a £ for £ impact on a company’s share price (not least because of the impact of deferred tax), but this analysis gives a good indication of those companies most positively (and negatively) affected by their pension schemes in their last financial year.
The FTSE 100 companies most positively affected by their pension schemes were:
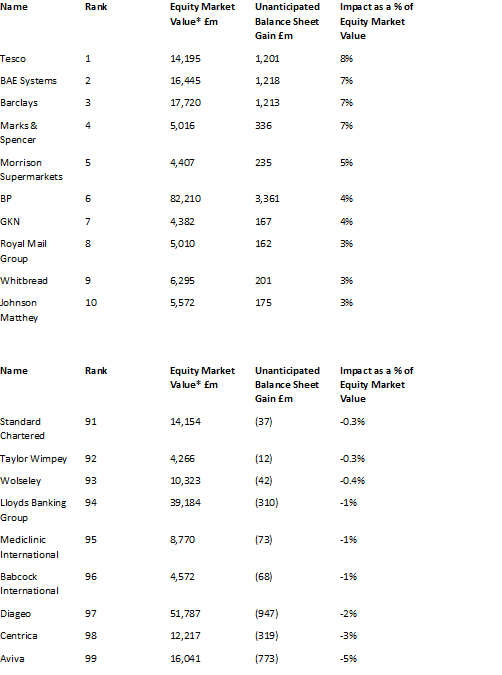
*as at 30 June 2016
Over the year covered by their latest report and accounts, 58 companies felt the benefit of an unexpected gain to their balance sheet as a result of their pension schemes, whilst 29 companies suffered an unexpected loss to their balance sheet as a result of their pension schemes.
CONTRIBUTIONS PAID INTO PENSION SCHEMES
This analysis compares the pension scheme contributions actually paid by companies with the cost of pension benefits accrued during the year. Surplus pension contributions paid in excess of the cost of benefits will reduce pension scheme deficits. However, where the contributions paid are less than the cost of benefits, this will increase pension scheme deficits (or reduce pension scheme surpluses).
The large increases in the contributions seen in the last couple of years have ended, with the amount contributed in the most recent accounting year being £ 0.2 billion lower than the amount contributed the previous year.
Only contributions actually paid in the relevant accounting year are included in the analysis below.
The FTSE 100 companies who have made the largest surplus contributions to their pension schemes were as follows:

* The Cost of Benefits recognised in the income statement of the Barclays was reduced by a past service cost credit of £434million.
In total, the amount contributed to FTSE 100 company pension schemes was £13.2billion, down from £13.4 billion in the previous accounting year. This is more than the £6.9 billion cost of benefits accrued during the year. It therefore represents £6.3 billion of funding towards reducing pension scheme deficits. This is an increase on the previous year’s deficit funding of £6.1 billion.
CONFLICT OF INTEREST BETWEEN EMPLOYERS AND TRUSTEES
There is an inherent conflict of interest involved in the running of a pension scheme. The following tables aim to capture employers’ reluctance towards contributing to their pension schemes against their relative enthusiasm for declaring dividends for their shareholders.
The total disclosed pension deficit of the FTSE 100 companies was £25 billion and the total dividends paid by companies with a defined benefit pension scheme in the FTSE 100 was £68.5 billion. This compares to a deficit of £48 billion and dividends of £67 billion one year ago. In total, the amount contributed to FTSE 100 company pension schemes was £13.2 billion, down from £13.4 billion in the previous accounting year.
46 FTSE 100 companies could have settled their pension deficits in full with a payment of up to one year’s dividends. Seven companies would need a payment of up to two years’ dividends to settle their pension deficit in full and seven companies would need a payment of more than two years dividends in order to settle their pension deficit in full.
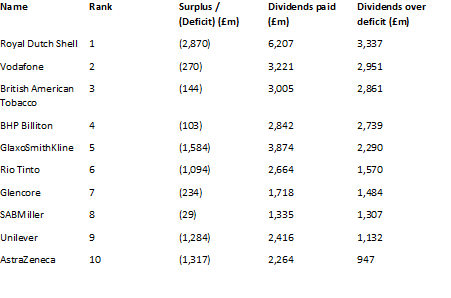
The following companies had the highest excess of dividends paid over the latest disclosed pension scheme deficit. This might suggest that these companies could not only wipe off their pension scheme deficit right away but also potentially contribute significantly towards de-risking opportunities.
The following companies had the highest levels of pension scheme contributions relative to their dividends declared in a year. This may suggest that these companies are prioritising the financial health of their pension schemes over making returns to shareholders.

If you do have a UK pension now is the right time to be speaking to us, as specialists we can assess the current markets and advise on the best practice moving forward, with the interest rates so low currently the values are very good, BUT when the interest rates increase (Potentially twice this year) your pension value will go lower.
We don’t charge for a pension valuation and will offer a full detailed report so please let me know by return email
All the best and have a great day
CEO
+60 3 2026 0286
NOTES
All of the analysis contained in this report is based on the IAS19 numbers disclosed in a company’s most recently published annual report and accounts.
No adjustment is made for the fact that companies have applied different interpretations of IAS19 and have used different actuarial assumptions (for example, different mortality assumptions can make a significant difference to a company’s pension liabilities).
No adjustment is made in the individual analysis for the fact that companies have different year-ends. Inevitably, different market conditions applying at different year-ends will affect the comparisons.
The assets and liabilities shown are the total global pension assets and liabilities, not just the UK figures.
The figures shown in this report are before adjustment for IFRIC14 (and before adjustment for any other unrecognised pension surpluses), except for Unanticipated Balance Sheet Impact, which is shown net of the change in irrecoverable surplus.
